In this guide,
We’ll cover the top methods for debugging JavaScript—from basics like console.log() to advanced tools like browser DevTools and network debugging—along with handy tips to streamline your process.
Let’s dive in and turn errors into “aha!” moments.
1. The Power of Console Logging: More Than Just console.log()
Console Logging Matters
Console logging is essential for JavaScript debugging, but there’s more than just console.log(). Here are some powerful, underused tools in the console object:
1.1 console.log() – A Classic with a Twist
Let’s kick things off with console.log() but add some humor to the mix. Instead of the usual “Hello, World!”, how about logging a developer’s inner thoughts?
console.log("Hover Console is a Chrome extension to make JavaScript debugging efficient");
console.log("It helps you track real-time logs and errors directly on your page.");
Output:

Tip: Use string interpolation (${}) to include variables inside your logs for more meaningful outputs.
let toolName= "Hover Console";
console.log(`Check ${toolName} for better debugging.`);

1.2 console.table() – Making Data Less Boring
Instead of using the key-value format, use console.table() to display arrays or objects in a nice, structured table.
const bugList = [
{ id: 1, description: "Button not working", priority: "Critical" },
{ id: 2, description: "Update Hover Console", priority: "High" },
{ id: 3, description: "Text alignment is off", priority: "Low" }
];
console.table(bugList);
Output:

1.3 console.group() and console.groupEnd() – Organizing Your Logs
With console.group(), you can group related logs and collapse them, creating a neat, organized output.
console.group("Morning Routine");
console.log("1. Check Hover Console");
console.log("2. Respond to users");
console.warn("3. Fix the hardest bug");
console.groupEnd();
Output:

Perfect for when your console starts to resemble an infinite scroll!
1.4 console.time() and console.timeEnd() – Measuring Code Performance
To deal with slow code Enter console.time() and console.timeEnd(), your very own performance detectives.
console.time("Hover Console Started");
setTimeout(() => {
console.timeEnd("Hover Console Started");
}, 5000); // Simulating a 5-second break from coding
Output:

More seriously, use this to measure how long specific code blocks take to execute.
1.5 console.assert() – Debugging with Attitude
Try console.assert(). If the condition is false, it will log an error.
let codingTime = 8; // in hours
console.assert(codingTime < 5, "No way you've been using Hover Console less than 5 hours today!");
Output:

1.6 console.dir() – A Better Way to Inspect DOM Elements
With console.dir()You can view the element as a JavaScript object, which gives You can access its properties and methods directly in the console.
let button = document.querySelector('button');
console.dir(button);
Output:

Closing Tip: Logging with Style
You can also add some style to your logs to make important information stand out!
console.log("%cHover Console, the Timesaver", "color: green; font-weight: bold; font-size: 20px;");
Output:

Next time you’re debugging JavaScript, don’t just stick to console.log(). These additional console methods can save you time, and effort, and give you a laugh when you need it most.
2. Debug JavaScript Using Hover Console: Ultimate Debugging Companion
The Hover Console is a powerful Chrome extension that lets developers view console logs and debug information right on the page, making debugging faster and more efficient.
Here’s a step-by-step guide to using Hover Console with examples:
2.1 Basic Logging with console.log()
Start by logging variables or messages to quickly inspect values. Hover Console displays the logs as you hover, so there’s no need to open the developer console.
const toolName = "Hover Console";
console.log("Tool name:", toolName);
Output:

2.2 Error Reporting with console.error()
Use console.error() to display errors directly on your webpage. Hover Console highlights errors in red, making them easy to spot.
const user = null;
if (!user) {
    console.error("User data not found in Hover Console!");
}
Output:

2.3 Warning Notifications with console.warn()
When you want to notify but not interrupt code execution, use console.warn() to log a warning. Hover Console displays warnings in yellow for quick attention.
const userLimit = 5;
const currentUsers = 6;
if (currentUsers > userLimit) {
    console.warn("User limit exceeded in Hover Console!");
}
Output:

2.4 Display Tabular Data with console.table()
console.table() formats objects and arrays into a table, which Hover Console shows inline, making data inspection visually simple.
const hoverConsoleUsers = [
{ id: 1, name: "Khalid" },
    { id: 2, name: "Shihab" },
    { id: 3, name: "Shakil" }
];
console.table(hoverConsoleUsers);
Output:

Hover Console makes debugging seamless by integrating these console methods directly into your webpage. By using these commands, you can save time and stay focused on code without switching tabs.
3. Debugging with Browser Developer Tools: Your Step-by-Step Guide
Browser Developer Tools allow you to do more than just log data; you can inspect the DOM, set breakpoints, monitor network activity, and much more.
3.1 Chrome Developer Tools: A Comprehensive Overview
Chrome DevTools is a powerhouse for debugging JavaScript, and it’s accessible with a simple press of F12. From real-time editing of your DOM to setting breakpoints and tracking network requests.
The Console Tab: Beyond Basic Logging
Accessing DOM Elements with Shortcuts
You might know about console.log(), but did you know you can quickly access DOM elements with built-in shortcuts?
For example, if you want to inspect a button on your page:
<button id="magicButton">Click Me!</button>
//In the Console tab:
console.log($0); // Logs the currently selected DOM element (magicButton in this case)
Output:

You can use $0, $1, etc., to reference the most recently inspected elements, helping you avoid repetitive document.querySelector() commands.
Modifying the DOM from the Console
Here’s a quirky way to interact with your page directly:
$0.innerText = "Debugged! using Hover Console";
$0.style.backgroundColor = "gray";
Output:

With this, you’ve just transformed a button’s text and color without touching the HTML source file!
3.2 Setting Breakpoints: Pause and Step Through Code
Line-of-Code Breakpoints: Pausing at the Right Moment
Breakpoints are your debugging GPS, allowing you to pause execution exactly where you need to inspect your code. Let’s say you have the following function:
function debugJS(issue1, issue2) {
  let solution = `${issue1} and ${issue2} solution `;
  console.log(solution);
  return solution;
}
debugJS('undefinedObj', 'dataNotSaved');
Output:

To debug this:
- Open the Sources tab.
- Find the script running this function.
- Set a breakpoint on the line: let solution= ….
Reload the page, and the browser will pause at your breakpoint, allowing you to inspect the current values of issue1, issue2, and solution.
Conditional Breakpoints: Stop Only When It Matters
If you want to pause only under certain conditions (e.g., when the solution issues are specific), use a conditional breakpoint:
issue1=== 'undefinedObj' && issue2=== 'dataNotSaved';
Right-click on the line number, select Add Conditional Breakpoint and add the above condition. Now the breakpoint will only trigger when the exact conditions are met.
3.3 Using the debugger Keyword: Set Breakpoints Programmatically
You can insert breakpoints directly into your code using the debugger keyword:
function multiply(a, b) {
  debugger; // Pauses execution here
  return a * b;
}
multiply(5, undefined); // Watch what happens
Output:

When the browser hits the debugger line, it pauses execution just like with a manual breakpoint. Follow section 4 for more details about using the debugger keyword.
3.4 Understanding the Call Stack and Scopes
Call Stack: Tracking Function Calls
When you hit a breakpoint, the Call Stack in the right-hand panel shows the chain of function calls that led to that breakpoint. For example, if debugJS() was called inside solveIssue():
function solveIssue() {
  debugJS('undefinedObj', 'dataNotSaved');
}
solveIssue();
Output:
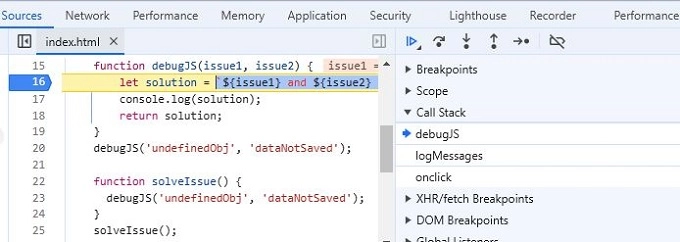
The Call Stack will display prepareLunch() calling makeSandwich(), helping you trace your code’s execution flow.
Scope and Watch Expressions: Monitoring Variables
The Scope panel shows all variables available at the current point in execution, whether they are global, function-scoped, or block-scoped. You can also add specific variables to the Watch panel to track their values over time.
3.5 Debugging API Calls with the Network Tab
Inspecting API Requests
The Network tab helps you inspect all network requests made by your app. For example, if you have this fetch request:
fetch('https://jsonplaceholder.typicode.com/posts')
  .then(response => response.json())
   .then(data => console.log(data))
    .catch(error => console.error('Oops, something went wrong:', error));
Output:
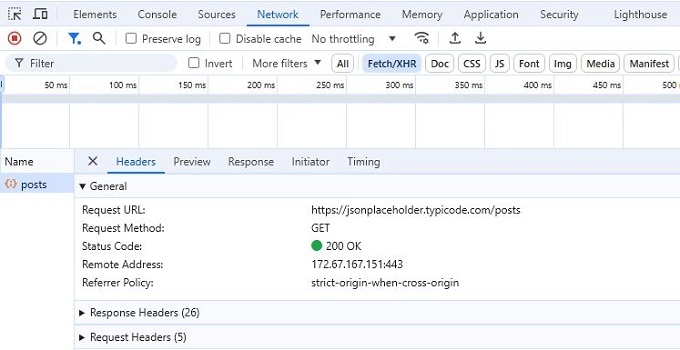
- Open the Network tab.
- Filter for XHR to show API calls.
- Select the post request to inspect its status, headers, and response data.
This lets you diagnose issues like CORS errors or track down a missing API response.
Debugging Failed Requests
If an API request fails (e.g., 404 or 500 errors), the Network tab will show the status code and let you inspect the response body for clues.
3.6 The Performance Tab: Optimizing Your App
The Performance tab is where you can profile your app’s performance. Here’s how to do it:
- Click Record in the Performance tab.
- Interact with your page.
- Stop the recording.
Chrome will give you a detailed breakdown of the time spent on scripting, rendering, and layout. This helps you identify bottlenecks, whether from unoptimized JavaScript or excessive layout reflows.
3.7 Blackboxing: Skip Over Unnecessary Code
If you’re working with third-party libraries that you don’t need to debug, you can blackbox them:
- Right-click the file in the Sources tab.
- Select Blackbox Script.
Now, Chrome will skip over that file during debugging, so you can focus on your code instead of sifting through irrelevant libraries.
3.8 Event Listener Breakpoints: Track User Interactions
You can set breakpoints for specific events like mouse clicks, form submissions, or key presses:
- Go to the Sources tab.
- Open Event Listener Breakpoints in the right panel.
- Select Mouse > click.
Chrome will pause execution every time a click event is triggered, letting you inspect exactly what happens during user interactions.
3.9 Debugging in Other Browsers
While Chrome is often the go-to, Firefox, Edge, and Safari offer similar tools:
- Firefox: Press Ctrl + Shift + I to access Firefox Developer Tools, which includes cool features like the Grid Inspector.
- Edge: Press F12 for Edge’s Developer Tools. It even offers compatibility testing for older Internet Explorer versions.
- Safari: Enable the Develop menu via Preferences > Advanced, and then use Command + Option + C to access the dev tools.
Mastering Chrome Developer Tools (and others) is key to improving your JavaScript debugging skills. From powerful breakpoints and the debugger keyword to real-time DOM manipulation and API monitoring, these tools make debugging faster and less frustrating.
4. Debugging with the debugger Keyword: Pausing Your Code Programmatically
Forget manually clicking around DevTools to set breakpoints—this bad boy lets you drop breakpoints straight into your code. Think of it as the “easy button” for pausing execution.
4.1 How the debugger Keyword Works
Here’s the deal: slap the debugger keyword into your code, and boom—execution pauses at that exact point. But heads up—it only works when DevTools are open.
Check this out:
function multiply(a, b) {
  debugger; // Yep, execution stops here.
  return a * b;
}
multiply(5, undefined); // Something seems fishy, let's pause.
Perfect for moments when your code’s misbehaving and you’re like, “Wait… what just happened?”
4.2 Practical Use Cases for debugger
Taming Loops and Conditionals
Drop a debugger inside your loop, and you’ll be able to pause right where it goes off the rails.
const numbers = [10, 20, 30, 40, 50];
numbers.forEach((number) => {
  if (number === 30) {
      debugger; // Ah-ha! Let’s pause when the number is 30.
   }
  console.log(`Hover console log counting number: ${number}`);
});
Output:

Boom. The code pauses at number 30. No more endless loop nightmares. Plus, you can peek at all those variable values in DevTools.
Debugging Dynamic Variables
Dynamic data can be a sneaky little beast, especially when your objects come from who-knows-where (cough, API calls). Imagine your tool object is coming in a bit… incomplete:
function processUserData(tool) {
   if (!tool.name || !tool.price) {
     debugger; // Let’s take a look when the data is missing.
   }
   console.log(`Processing ${tool.name}, price ${tool.price}`);
}
const tool= { name: "Hover Console" }; // Whoops, missing price!
processUserData(tool);
Output:

“Hold up, what’s going on here?” debugger keyword gives you the chance to poke around in DevTools and figure out what’s missing.
4.3 Debugging Asynchronous Code
Ah, async code—both a blessing and a curse. Toss debugger into the mix.
Async Function Debugging
async function fetchData(url) {
  const response = await fetch(url);
  debugger; // Let’s pause after fetching the data.
  const data = await response.json();
  console.log(data);
}
fetchData('https://jsonplaceholder.typicode.com/posts');
Output:

We’re pausing right after the data returns, but before it’s processed.
Debugging Promise Chains
fetch('https://jsonplaceholder.typicode.com/posts')
  .then(response => {
    debugger; // Pause before diving into the response.
    return response.json();
   })
   .then(data => console.log(data));
Output:

This way, you can ensure that the promise is actually resolving as you expect (or even at all).
4.4 Combine debugger with Conditionals
Mix debugger with an if-statement, and you’ll feel like a debugging ninja.
Debugging Edge Cases
Imagine you’ve got an array of extensions, and you’re only interested in the minimal prices(for debugging purposes, of course):
const extensions = [
  { name: "Hover Console", price: 16 },
  { name: "XYZ", price: 40},
  { name: "PQR", price: 25 }
];
extensions.forEach(extension => {
  if (extension.price< 18) {
     debugger; // Let’s freeze time when an extension is underprice.
  }
  console.log(`${extension.name} is ${extension.price} USD`);
});
Output:

4.5 Avoiding debugger in Production (Oops)
Quick reminder: Your users don’t want their browsers to freeze just because you forgot to clean up your code.
To ensure that never happens, get yourself a trusty linter like ESLint. It’ll tap you on the shoulder and say, “Hey, are you sure you want to ship that debugger to production?”
And that’s how you can use the debugger keyword like a pro. Happy debugging, friend!
5. Exploring the Network Tab: Debugging HTTP Requests Like a Detective
Alright, time to channel your inner detective because the Network Tab is where all the action happens.
5.1 Start with the Basics: What’s Happening Behind the Scenes?
The Network Tab gives you a front-row seat to all HTTP requests made by your browser—every GET, POST, PUT, and DELETE is logged here.
To get started, just open DevTools (hit F12), switch to the Network tab and refresh the page. You’ll see a waterfall of requests flowing in.
5.2 The Key Clues: Status Codes, Headers, and Response Bodies
Every request gives you three critical pieces of information:
- Status Code: This is your first hint—did it succeed? Fail? 200 means “all good,” 404 means “not found,” and 500 means “uh oh, server’s having a meltdown.”
- Headers: What kind of data are you sending? What’s being sent back? Headers tell you everything about how data is transported.
- Response Body: You can see exactly what the server sent back. Sometimes, your app isn’t lying; it’s just got nothing interesting to show.
Failed POST Request
Let’s say you’re trying to send some form data to your server, but nothing’s happening. What gives? Time to hit up the Network Tab.
fetch('/submit', {
   method: 'POST',
  body: JSON.stringify({ name: 'Hover Console', price: 25 }),
  headers: { 'Content-Type': 'application/json' }
})
.then(response => response.json())
  .then(data => console.log(data))
    .catch(error => console.error('Error:', error));
In the Network Tab, you’ll see the POST request to /submit. If you see a 500 status code, it’s time to investigate the response.
5.3 Debugging Slow API Calls (The Waiting Game)
You’ll notice each request has a Timeline next to it. You can see exactly how long each request took, and whether it’s getting hung up on DNS lookups, SSL handshakes, or just a slow server.
Investigating a Slow Request
If you see that a specific request is taking way longer than the others, you can dig into the timing details:
- DNS Lookup: Is the domain taking too long to resolve?
- TTFB (Time to First Byte): Is the server slow to respond?
- Content Download: Maybe the payload is just huge. That 10MB GIF might be a problem…
The Network Tab will break down every millisecond of your request. You’ll feel like Neo from The Matrix watching HTTP requests slow down in bullet time.
5.4 Monitoring WebSockets & Live Data Feeds
API calls aren’t the only thing you can debug here. If you’re working with WebSockets for real-time data (like chats or stock tickers), the Network Tab is your new best friend.
If your WebSocket suddenly drops or starts misbehaving, you’ll see it right here in the Network Tab, like a livestream of everything happening behind the scenes.
Debugging a WebSocket Connection
const socket = new WebSocket('ws://example.com/socket');
socket.onopen = () => {
  console.log('Connected to WebSocket');
  socket.send('Hello Hover Console Fans');
};
socket.onmessage = (event) => {
  console.log('Received:', event.data);
};
5.5 Request Filters: Sherlock Mode Activated
The Network Tab has filters. You can narrow down the requests to just the ones you care about—like filtering for only XHR (AJAX) requests or WebSockets.
Filtering for XHR Requests
Imagine you only want to see your AJAX requests and skip all the static assets (CSS, images, fonts).
- Open the Network Tab.
- Click on XHR in the filter bar.
- Bam! Now you’re only looking at the juicy API calls.
5.6 Mocking Requests with DevTools (Yes, You Can Fake It)
Okay, here’s a cool party trick: Did you know you can fake a server response in the Network Tab? You can manually edit and re-send requests, or even use a tool like Postman to test different responses.
Re-sending a Request
Right-click on any request in the Network Tab, and you’ll see the option to “Replay XHR” or “Edit and Resend.” This lets you tweak the request body, headers, or even the URL. It’s like hacking your app (for good, of course).
5.7 Throttling: Simulate a Slow Connection
The Network Tab lets you simulate slower networks. Try throttling the connection to Fast 3G or Slow 3G and see if your app can handle the heat.
- Open DevTools and go to the Network tab.
- At the top, look for the Online/Throttling dropdown.
- Select a speed (like Slow 3G), and watch your requests crawl.
Whether you’re dealing with slow requests, failed API calls, or real-time WebSocket issues, the Network Tab has your back. It’s your bug-detecting Batcave.
Summary
This guide provided an in-depth overview of essential JavaScript debugging techniques, including enhanced console logging methods, real-time element inspection with HoverConsole, and advanced features within browser developer tools.
It also highlighted the importance of the debugger keyword, network tab diagnostics, and conditional breakpoints.
With these tools, you can effectively debug JavaScript, quickly identify and resolve issues, and streamline your coding workflow.

He is the founder of Hover Console.
Khalid began his career as a software engineer in 2003. He leads strategic initiatives, guiding Hover Console from start to finish, driving progress in software development. Passionate about using technology for positive change, Khalid excels in creating innovative solutions. He’s committed to collaboration, diversity, industry advancement, and mentoring aspiring developers.
