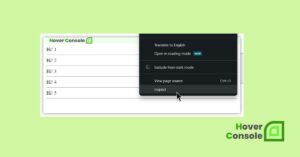
I made the same mistake, and it had me stuck for a while!
Most of the developers encountered this issue too! It’s essential to ensure that you’re inspecting the correct developer tools window.
Sometimes, we inadvertently open the developer tools for the main webpage instead of the extension’s popup (i.e., popup.html).
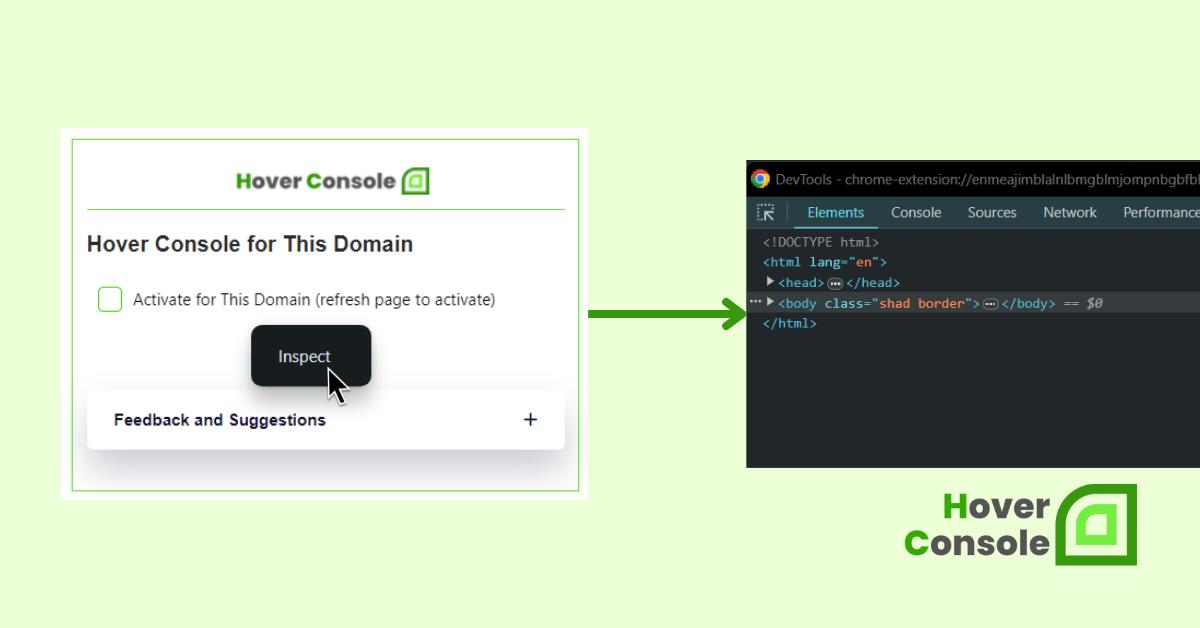
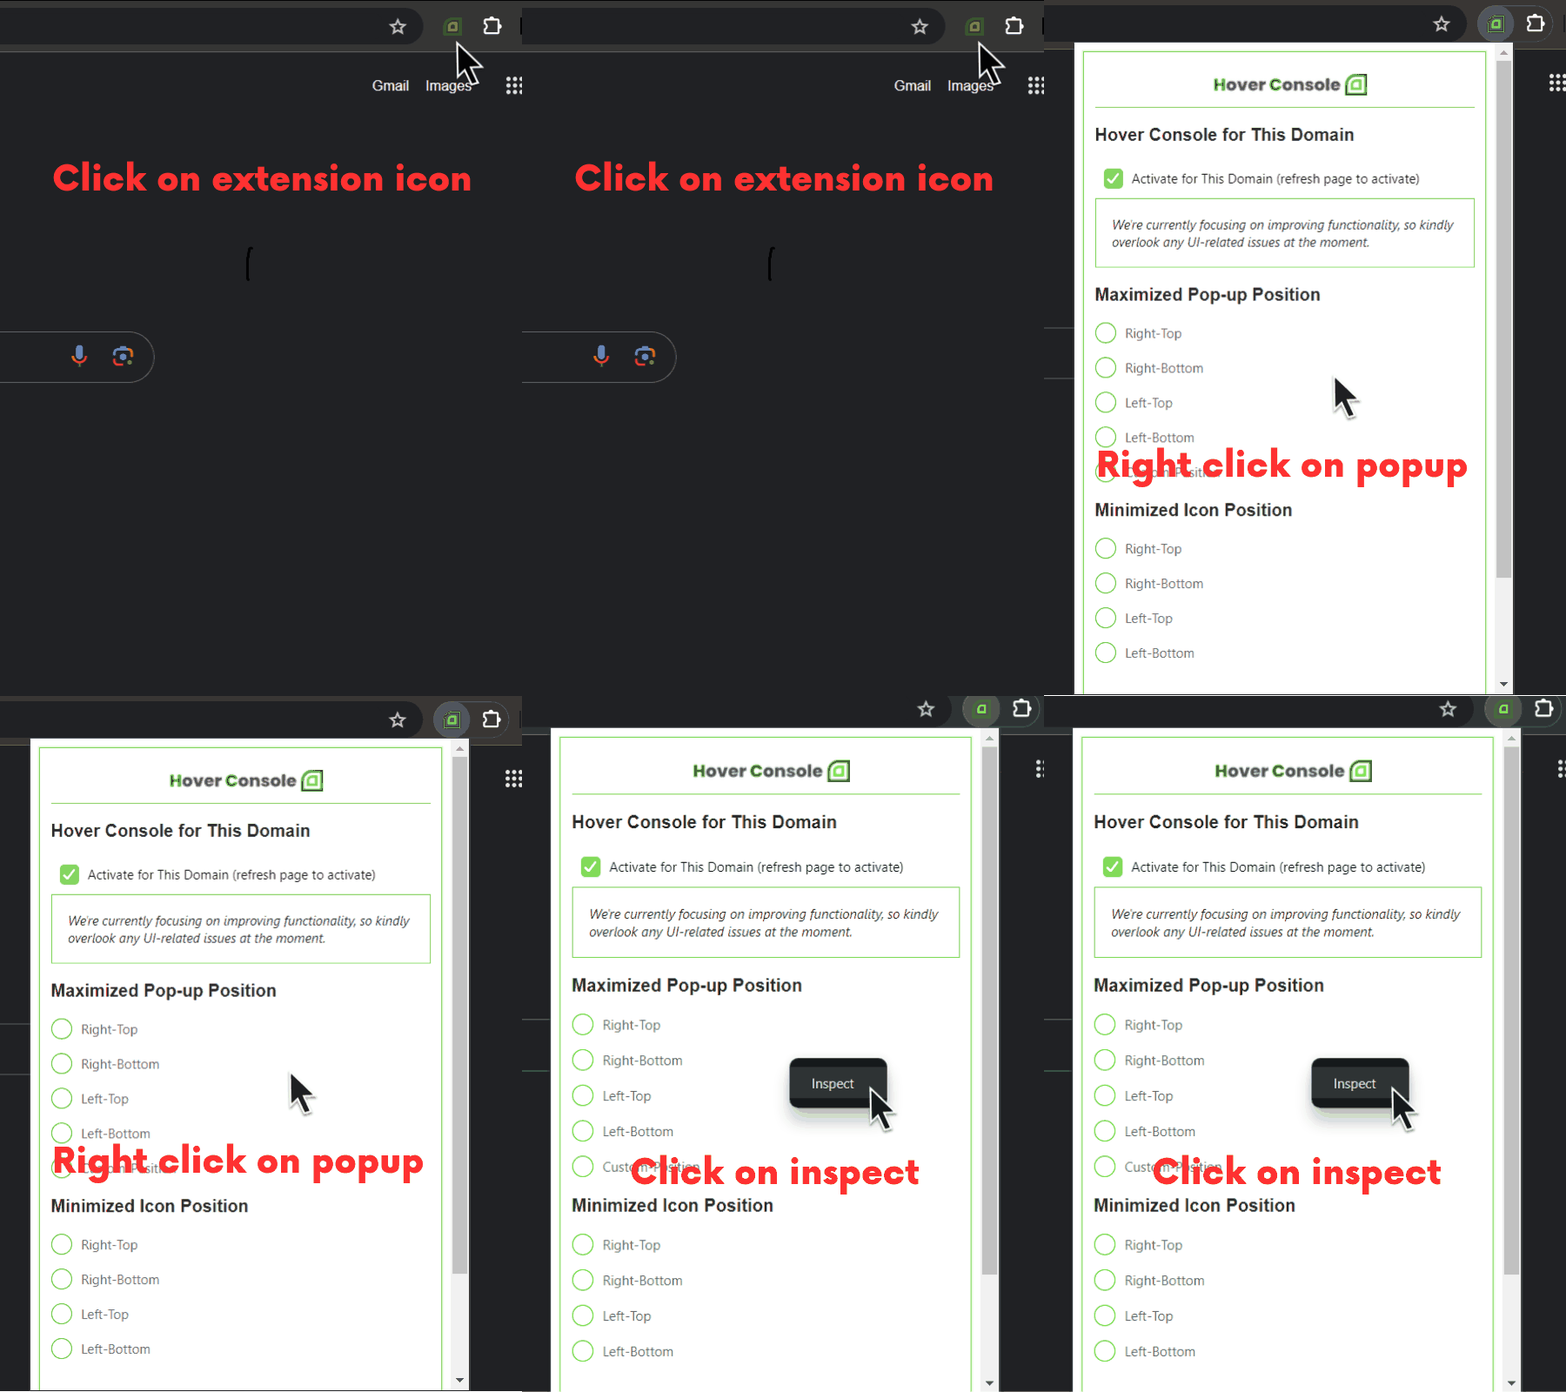
To access the developer tools window for inspecting the popup, follow these steps:
- Click on the extension icon. it will open a popup.
- Right-click on the popup window and select “
Inspect“. - This action will open the appropriate
DevToolswindow specifically for the popup.
Alternatively
Popup (built-in): Right-click on your browserAction button and select “Inspect Popup“. This will open the DevTools for the popup page.
Similar to read:
- How console.log() in Chrome extension from content scripts read this.
- How console.log() in Chrome extension from background script read this.
He is the founder of Hover Console.
Khalid began his career as a software engineer in 2003. He leads strategic initiatives, guiding Hover Console from start to finish, driving progress in software development. Passionate about using technology for positive change, Khalid excels in creating innovative solutions. He’s committed to collaboration, diversity, industry advancement, and mentoring aspiring developers.
