While the standard usage of newlines in console.log() is straightforward, several creative and unconventional techniques can significantly improve your debugging experience.
These methods can enhance clarity, organization, and the overall flow of your logs, making it easier to identify and resolve issues in your JavaScript code.
Basic Newlines
Using the escape sequence \n
console.log("Hover Console Debugging Tool:\nStep 1: Completed\nStep 2: In Progress\nStep 3: Pending");
Output:

In addition to using the escape character \n, there are several other effective ways to introduce newlines in your console output.
These approaches can enhance clarity and provide flexibility for different scenarios. Let’s explore creative techniques to generate newlines while maintaining a clean and organized logging structure.
Here are some alternative methods:
Template Literals
Use backticks for multiline strings:
console.log(`Hover Console Debugging Tool:
Step 1: Start
Step 2: Process
Step 3: Complete`);
Output:

Empty Console Calls
Insert blank console.log() statements:
console.log("Hover Console Debugging Started:");
console.log("Step 1: Initialized");
console.log();
console.log("Step 2: Processed");
console.log("Step 3: Completed");
Output:

Now Let’s explore creative ways to use console.log() with \n for efficient debugging in JavaScript.
We’ll learn structured logging techniques, comparisons across frameworks like Node.js, React, Angular, and Vue, and actionable examples to enhance your debugging experience.
Sectioning Log Output with Headers and Footers
By adding headers and footers to your logs, you can locate specific blocks of output when debugging long processes.
console.log("\n--- Start of User Data Fetching ---\n");
console.log(`Fetching User ID: 12345\nStatus: Success\nResponse Time: 200ms`);
console.log("\n--- End of User Data Fetching ---\n");
Output:

Why it’s effective: This approach provides a clear visual separation between different parts of your code, making it easier to focus on specific areas.
Creating Hierarchical Logs with Indentation Using Newlines
To create a hierarchical or nested structure in your logs, you can use tabs (\t) and newlines to indent the output.
console.log("Main Process:\n\tStep 1: Initialize\n\tStep 2: Fetch Data\n\t\t- Data fetched successfully\n\tStep 3: Process Data\n\t\t- Processing step 1\n\t\t- Processing step 2\n");
Output:

Why it’s effective: This gives you a visual representation of the flow of operations, making it easier to see at a glance what’s happening at each stage, especially in complex sequences.
Progressive Log Output with Controlled Line Breaks
You can incrementally print a series of logs with progressive information, simulating the feeling of step-by-step progress in your console.
console.log("Process started...\n");
setTimeout(() => console.log("Step 1 completed\n"), 1000);
setTimeout(() => console.log("Step 2 completed\n"), 2000);
setTimeout(() => console.log("Process finished!\n"), 3000);
Output (over time):

Why it’s effective: This method gives real-time updates, which is ideal for tracking the progress of async tasks.
Chained Logs for Interactive Debugging
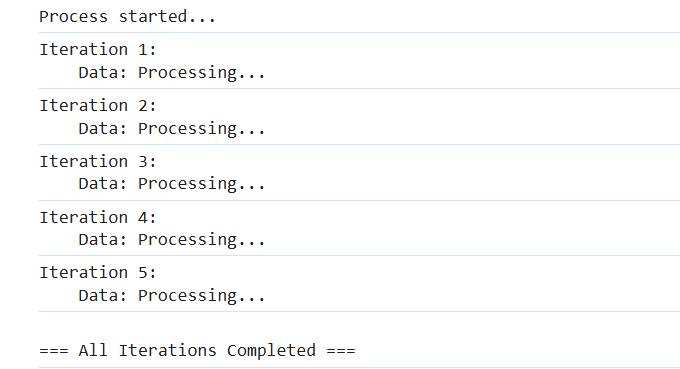
For debugging loops or repetitive tasks, you can create a chain of logs separated by newlines to track iterations or loop progress.
for (let i = 1; i <= 5; i++) {
  console.log(`Iteration ${i}:\n\tData: Processing...`);
  if (i === 5) console.log("\n=== All Iterations Completed ===\n");
}
Output:

Why it’s effective: This approach keeps track of the loop progress without cluttering the console, making each iteration’s output distinct while maintaining a clear end marker.
Using Newlines with Symbols for Enhanced Readability
You can combine newlines with symbols to create a highly readable, visually distinct pattern in your logs. This is especially useful when trying to highlight different sections or differentiate types of logs.
console.log("\n>>>>>> STARTING TESTS >>>>>>\n");
console.log("Running test case 1...\nTest Passed: ✅\n");
console.log("Running test case 2...\nTest Failed: ❌\n");
console.log("\n>>>>>> END OF TESTS >>>>>>\n");
Output:

Why it’s effective: Symbols combined with newlines can break the monotony of plain text output, making it easier to visually process results—especially when there are clear “start” and “end” markers for different sections of your logs.
Dynamic Log Generation with Arrays
Construct logs dynamically with arrays and join them with \n:
const logLines = [
"Hover Console Debugging Tool:",
"Step 1: Initialization Complete",
"Step 2: Data Fetched",
"Step 3: Process Complete",
];

console.log(logLines.join("\n"));
Output:

This method keeps logs modular and easy to update.
These unconventional uses of newlines in console.log() can significantly improve your debugging experience by making logs more readable, structured, and visually distinct.
Using console.log() with newlines in different JavaScript frameworks
Here’s a quick table showcasing common use cases for console.log() and newlines across environments:
| Framework/Environment | Common Use Cases | Example Scenario |
| Node.js | Server-side debugging, logging to files | Tracking API requests/responses |
| React | Debugging state/props, component renders | Monitoring component lifecycle |
| Angular | Debugging lifecycle hooks, services | Logging initialization, service calls |
| Vue | Watching reactive data | Debugging reactive UI updates |
Using console.log() with Newlines in Node.js
In Node.js, the backend environment offers opportunities to use console.log() for server-side debugging.
Basic Usage with Newlines in Node.js
console.log("\n--- Hover Console Debugging Tool ---\n");
console.log("Step 1: Server Started Successfully");
console.log("Step 2: Listening on Port 3000");
console.log("\n-----------------------------------\n");
Output:
— Hover Console Debugging Tool —
Step 1: Server Started Successfully
Step 2: Listening on Port 3000
Advanced Node.js Example with Streams
For scenarios like logging to files, you can use fs.createWriteStream with custom newline handling:
const fs = require("fs");
const logStream = fs.createWriteStream("logs.txt", { flags: "a" });
logStream.write("\n--- Hover Console Logs ---\n");
logStream.write("Step 1: Initialization Complete\n");
logStream.write("Step 2: Database Connected\n");
logStream.write("\n--- End of Logs ---\n");
logStream.end();
This logs your output to a file, ensuring organized debugging information for later review.
Using console.log() and newlines in React
React operates in the browser, and logs can assist in debugging component lifecycles, state changes, and props.
Logging Component State with Newlines
function HoverConsoleComponent() {
const [state, setState] = React.useState("Loading");
  React.useEffect(() => {
    console.log(`
Hover Console State:
========================
Initial State: ${state}
========================
    `);
    setState("Loaded");
  }, [state]);
  return <div>Check the console for logs!</div>;
}
Output:
Hover Console State:
========================
Initial State: Loading
========================
This approach is helpful when debugging asynchronous state changes or component re-renders.
Using console.log() with Newlines in Angular
Angular’s structured environment benefits from using console.log() for debugging lifecycle hooks and service data.
Example: Logging in Component Lifecycle Hooks
import { Component, OnInit } from '@angular/core';
@Component({
  selector: 'app-hover-console',
  template: `<p>Check the console for logs!</p>`,
})
export class HoverConsoleComponent implements OnInit {
  ngOnInit(): void {
    console.log(`
Hover Console Debugging:
------------------------------
Component Initialized
Data Fetching Started
------------------------------
    `);
  }
}
Output:
Hover Console Debugging:
——————————
Component Initialized
Data Fetching Started
——————————
This is ideal for keeping track of component-level events.
Using console.log() with newline in Vue
In Vue, logs can help monitor reactive data and watch for changes.
Example: Logging Reactive Data
<template>
  <div>Check the console for logs!</div>
</template>
<script>
export default {
  data() {
    return {
      status: "Initializing...",
    };
  },
  mounted() {
    console.log(`
Hover Console Debugging Tool:
-----------------------------
Status: ${this.status}
-----------------------------
    `);
    this.status = "Loaded";
  },
};
</script>
Output:
Hover Console Debugging Tool:
—————————–
Status: Initializing…
—————————–
This format is particularly effective for debugging dynamic UI changes in Vue applications.
Conclusion
console.log() with newline can enhance your debugging process by making your logs more readable, organized, and easier to follow.
Whether,
you’re working in Node.js, React, Angular, or Vue, you can leverage newlines creatively to gain better insights into your code’s behavior.
Combining basic techniques with advanced logging strategies ensures that your development experience remains smooth and effective.

He is the founder of Hover Console.
Khalid began his career as a software engineer in 2003. He leads strategic initiatives, guiding Hover Console from start to finish, driving progress in software development. Passionate about using technology for positive change, Khalid excels in creating innovative solutions. He’s committed to collaboration, diversity, industry advancement, and mentoring aspiring developers.


